Very low on micronutrients such as vitamin D and Magnesium – NHANES data
Foods, Fortificants, and Supplements: Where Do Americans Get Their Nutrients?
Victor L. Fulgoni III4, [email protected]
Debra R. Keast5,
Regan L. Bailey6, and
Johanna Dwyer7
4 Nutrition Impact LLC, Battle Creek, MI
5 Food and Nutrition Database Research, Inc., Okemos, MI
6 Office of Dietary Supplements, Bethesda, MD
7 Jean Mayer USDA Human Nutrition Research Center on Aging, and Schools of Medicine and Friedman School of Nutrition Science and Policy, Tufts University, Boston, MA
First published August 24, 2011, doi: 10.3945/?jn.111.142257 J. Nutr. October 1, 2011 jn.111.142257
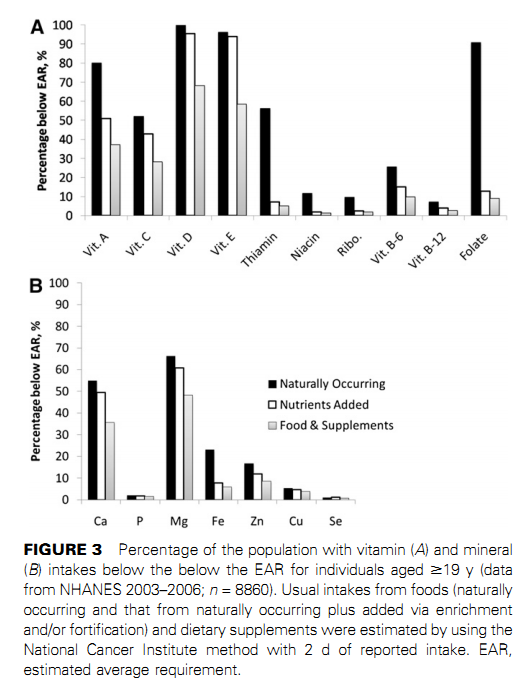
Limited data are available on the source of usual nutrient intakes in the United States. This analysis aimed to assess contributions of micronutrients to usual intakes derived from all sources (naturally occurring, fortified and enriched, and dietary supplements) and to compare usual intakes to the Dietary Reference Intake for U.S. residents aged ?2 y according to NHANES 2003–2006 (n = 16,110). We used the National Cancer Institute method to assess usual intakes of 19 micronutrients by source. Only a small percentage of the population had total usual intakes (from dietary intakes and supplements) below the estimated average requirement (EAR) for the following: vitamin B-6 (8%), folate (8%), zinc (8%), thiamin, riboflavin, niacin, vitamin B-12, phosphorus, iron, copper, and selenium (<6% for all).
However, more of the population had total usual intakes below the EAR for vitamins A, C, D, and E (34, 25, 70, and 60%, respectively), calcium (38%), and magnesium (45%). Only 3 and 35% had total usual intakes of potassium and vitamin K, respectively, greater than the adequate intake. Enrichment and/or fortification largely contributed to intakes of vitamins A, C, and D, thiamin, iron, and folate. Dietary supplements further reduced the percentage of the population consuming less than the EAR for all nutrients.
The percentage of the population with total intakes greater than the tolerable upper intake level (UL) was very low for most nutrients, whereas 10.3 and 8.4% of the population had intakes greater than the UL for niacin and zinc, respectively. Without enrichment and/or fortification and supplementation, many Americans did not achieve the recommended micronutrient intake levels set forth in the Dietary Reference Intake.
Example graph from PDF ( other figures in the PDF have other age groups)
Taller bar = more deficient
Note that EAR is a VERY low amount - much less than RDA
Manuscript received: March 31, 2011; Initial review completed: May 2, 2011; Revision accepted: July 17, 2011.
[tiki-download_file.php?fileId=1961] for PDF
See also Vitamin D Life
13 percent decrease in vitamin D levels over 13 years – corrected NHANES Feb 2012 lots of details
Overview Deficiency of vitamin D which contains the following graph for vitamin D from the same NHANES data
Only a tiny number of Americans eat even the "minimum wage" of vitamin D
orange line indicates the Institute of Medicine Nov 2010 minimum recommendations
Note that this shows American Vitamin D intake deficiency:
<5% of all females,
<10% of males
0% of females ages 14-31
0% of seniors (over age 71)

Only half as many people had >30 ng of vitamin D 16 years later
Approximately 44% in 1988 and 22% by 2004