Summary of Vitamin D trials - Grant
Original Jan 2012 - updated Nov 2012
CLICK HERE for web page which has Jan 2012 table and associated references & abstracts
Nov 2012 document with full references is attached at the bottom of this page
List of random controlled vitamin D trials covered in version of Jan 2012:
{SPLIT(colsize=220|220|320)}
All cause mortality
Atopic dermatitis
Bone loss in winter
Breast cancer
Colorectal cancer
Cancer, All
Cardiometric
Cardiovascular
Cardiovascular disease event
Chronic kidney disease
CVD survival
Depression
Falls
Falls, fractures
Gastric bypass
Glucose (fasting plasma) (FPG)
Haemodialysis
Heart failure, congestive
Infections, symptomatic upper respiratory tract
Infectious diseases
Influenza
Influenza type A
Insulin sensitivity
Multiple sclerosis
Muscle strength
Musculoskeletal parameters
Neuromuscular
Non-vertebrate fractures
Physical performance
Pneumonia
Pregnancy
Stress fractures
Testosterone
Tooth loss
Tuberculosis
{SPLIT}
See also by Dr. Grant
Vitamin D overview by Grant - Jan 2011 - Requirements for Vitamin D Across the Life Span
Strength of vitamin D evidence – Dr. Grant letter to editor July 2012
Evidence that the minimum vitamin D blood level is 30 ng – Grant Nov 2012
Outcome | Conditions | Finding | Reference |
Allcause mortality | Mean oral in take 528 IU/d | RR = 0.93(95% CI, 0.87-0.99) | Autier and Gandini, 2007 |
daily vitamin D(3) (800IU), calcium (1000 mg), both, or placebo for 24-62 months, with a follow-upof 3 yr after intervention | (HR) = 0.93; 95% confidence interval (CI) =0.85-1.02] | Avenell, 2012 | |
Allcause mortality | Vitamin D with or without calcium reduced mortality by 7%[hazard ratio, 0.93; 95% confidence interval (CI), 0.88-0.99]. However, vitamin D alone did not affect mortality, but risk ofdeath was reduced if vitamin D was given withcalcium (hazard ratio, 0.91; 95% CI, 0.84-0.98). The number needed to treatwith vitamin D plus calcium for 3 yr to preventone death was 151. Trial level meta-analysis (24 trials with 88,097participants) showed similar results, i.e. mortality was reduced with vitamin D plus calcium (odds ratio, 0.94; 95% CI,0.88-0.99), but not with vitamin D alone (oddsratio, 0.98; 95% CI, 0.91-1.06). | Rejnmark, 2012 | |
Atopicdermatitis | Sidbury, 2008 | ||
Boneloss in winter | oral cholecalciferol (500 IU/day) and calcium (500mg/day) during the winter months | In the subjects receiving oral vitamin D3 andcalcium, lumbar and femoral BMD increased significantly (lumbar spine: +0.8%,p = 0.04 versus year 1; femoral neck: +0.1%, p = 0.05 versus year 1), whereascontrols continued to lose bone (intervention group versus control group:lumbar spine, p = 0.03; femoral neck, p = 0.05). | Meier, 2004 |
Cancer,All | 1100 IU/d, 1450 mg/d calcium | When analysis was confined to cancers diagnosedafter the first 12 mo, RR for the Ca + D group fell to 0.232 (CI: 0.09, 0.60;P < 0.005) but did not change significantly for the Ca-only group. | Lappe, 2007 |
daily vitamin D(3) (800IU), calcium (1000 mg), both, or placebo for 24-62 months, with a follow-upof 3 yr after intervention | cancer mortality (HR = 0.85; 95% CI = 0.68-1.06),and cancer incidence (HR = 1.07; 95% CI = 0.92-1.25) | Avenell, 2012 | |
Breast,colorectal cancer | 400 IU/d vitamin D3, 1500 mg/d or placebo | In 15,646 women (43%) who were not taking personalcalcium or vitamin D supplements atrandomization, CaD significantly decreased the risk of total, breast, andinvasive breast cancers by 14-20% and nonsignificantly reduced the risk ofcolorectal cancer by 17%. In women taking personal calcium or vitamin D supplements, CaD did not alter cancer risk(HR: 1.06-1.26). | Bolland, 2011 |
Cardiometric | In meta-analyses of 10 trials | supplementation nonsignificantly reduced systolicblood pressure (weighted mean difference, -1.9 mm Hg [CI, -4.2 to 0.4 mm Hg])and did not affect diastolic blood pressure (weighted mean difference, -0.1mm Hg [CI, -0.7 to 0.5 mm Hg]). | Pittas, 2010 |
Cardiovascular | Vitamin D supplementation during weight loss | more pronounced decrease occurred in the vitamin Dgroup than in the placebo group in blood concentrations of parathyroidhormone (-26.5% compared with -18.7%; P = 0.014), triglycerides (-13.5%compared with +3.0%; P < 0.001), and the inflammation marker tumornecrosis factor-alpha (-10.2% compared with -3.2%; P = 0.049). | Zittermann, 2009 |
Cardiovasculardisease event | Pooled study | .Results of secondary analyses in 8 randomizedtrials showed a slight but statistically nonsignificant reduction in CVD risk(pooled relative risk, 0.90 [95% CI, 0.77 to 1.05]) with vitamin D supplementation at moderate to high doses(approximately 1000 IU/d) but not with calcium supplementation (pooledrelative risk, 1.14 [CI, 0.92 to 1.41]), or a combination of vitamin D and calcium supplementation (pooled relativerisk, 1.04 [CI, 0.92 to 1.18]) compared with placebo. | Wang, 2010 |
CVD | Participantswere randomized 2:1 to vitamin D3 4,000 IU daily or placebo for 12 weeks. Theprimary outcome was a change in flow-mediated brachial artery dilation (FMD). | Baseline demographics were similar except for age (vitamin D versus placebo, mean ±sd 47 ±8 versus 40 ±10years; P=0.009). Both groups had reduced FMD at baseline (median values 2.9%[IQR 1.6-4.8] for vitamin D versus 2.5% [IQR1.7-6.4] for placebo; P=0.819). Despite an increase in the concentration ofserum 25-hydroxyvitamin D from baseline to 12 weeks (5.0 ng/ml [IQR -0.9-7.4]versus -1.9 ng/ml [IQR -4.0-0.1] for vitamin Dversus placebo, respectively; P=0.003), there was no difference in FMD change(0.55% [IQR -1.05-2.13] versus 0.29% [IQR -1.61-1.77]; P=0.748). Vitamin D supplementation was associated with adecrease in total and non-high-density lipoprotein cholesterol, and anincrease in indices of insulin resistance. | Longenecker, 2012 |
CVDsurvival | Vitamin D supplementationconferred substantial survival benefit (odds ratio for death 0.39, 95%confidence interval 0.28 to 0.53, p <0.0001). | Vacek, 2012 | |
Chronickidney disease | Placeboor calcium (1,200 mg) and vitamin D(3) (800 IU) in fixed or separatecombination. Effect on parathyroid hormone | The proportion with a 30% or greater decrease iniPTH level at 6 months was 50% in all eGFR groups on treatment versus 6% to9% for placebo (P < 0.001 for all). The effects of the intervention oniPTH levels did not differ according to baseline eGFR (interaction P > 0.1for all times). | Kooienga, 2009 |
1000 IU/d vs. placebo | Mean 25(OH)D levels increased significantly higherin the treatment group (mean increase from baseline: 10.3+/-10.4 ng/mL vs.0.8+/-6.8 ng/mL, p<0.0001). | Rucker, 2009 | |
Successful 25OHD replacement was defined asprescription of ergocalciferol sufficient to increase serum 25OHD level by25% from baseline within 6 months (treatment group, n = 90). Otherwisepatients were considered as untreated controls (n = 36). The date when the25OHD level was drawn was considered as the date of inclusion. All thepatients were followed up from the date of inclusion until July 2009 tocapture CV events prospectively. | During mean follow-up of 27.2 months, 44% of thecontrols had CV events, whereas only 21% of the patients in the treatmentgroup had CV events (P = 0.001). In multivariate logistic regressionanalysis, adjusting for CV disease predictorsage, initial parathyroid hormone level, statin use, history of CV disease, and glomerular filtration rate, the estimatedodds ratio for 25OHD replacement status was 0.37 (95% confidence interval:0.14-1.0). | Lishmanov, 2012 | |
Depression | Cross-sectional study and randomized double blindcontrolled trial of 20,000 or 40,000 IU vitamin D per week versus placebo for1 year. | In the two groups given vitamin D, but not in theplacebo group, there was a significant improvement in BDI scores after 1year. There was a significant decrease in serum parathyroid hormone in thetwo vitamin D groups without a concomitant increase in serum calcium. | Jorde, 2008 |
Falls,fractures | 700-1000 IU/d | Pooled RR = 0.81 (95% CI 0.71 to 0.92) No effect for 400 IU/d | Bischoff-Ferrari, 2009b |
Falls | Our study population consisted of 242 individualsrecruited by advertisements and mailing lists (mean [ +/- SD] age, 77 +/- 4years). All serum 25-hydroxyvitamin D (25[OH]D) levels were below 78 nmol/l.Individuals received in a double blinded fashion either 1000 mg of calcium or1000 mg of calcium plus 800 IU of vitamin D per day over a treatment periodof 12 months, which was followed by a treatment-free but still blindedobservation period of 8 months. | Compared to calcium mono, supplementation withcalcium plus vitamin D resulted in a significant decrease in the number of subjectswith first falls of 27% at month 12 (RR = 0.73; CI = 0.54-0.96) and 39% atmonth 20 (RR = 0.61; CI = 0.34-0.76). Concerning secondary endpoints, we observedsignificant improvements in quadriceps strength of 8%, a decrease in bodysway of 28%, and a decrease in time needed to perform the TUG test of 11%. | Pfeifer, 2009 |
Non-vertebratefractures | 700-1000 IU/d | pooled RR was 0.80 (95% CI, 0.72-0.89; | Bischoff-Ferrari, 2009a |
Fractures | Participants who were randomly assigned to receivevitamin D, as compared with those assigned to control groups, | had a nonsignificant 10% reduction in the risk ofhip fracture (hazard ratio, 0.90; 95% confidence interval [CI], 0.80 to 1.01)and a 7% reduction in the risk of nonvertebral fracture (hazard ratio, 0.93;95% CI, 0.87 to 0.99). By quartiles of actual intake, reduction in the riskof fracture was shown only at the highest intake level (median, 800 IU daily;range, 792 to 2000), with a 30% reduction in the risk of hip fracture (hazardratio, 0.70; 95% CI, 0.58 to 0.86) and a 14% reduction in the risk of anynonvertebral fracture (hazard ratio, 0.86; 95% CI, 0.76 to 0.96). | Bischoff-Ferrari, 2012 |
Flow-mediateddilation | Following 16 weeks of placebo (n = 23; mean age 31 ±2 years) or 60,000 IU monthly oral vitamin D(3)(n = 22; mean age 29 ± 2 years), serum concentrations of 25-hydroxyvitamin D(25(OH)D) increased from 38.2 ± 3.0 to 48.7 ± 3.2 nmol/l and 34.3 ± 2.2 to100.9 ± 6.6 nmol/l, respectively. | No changes in serum parathyroid hormone (PTH), serum calcium, orurine calcium/creatinine were observed followingeither treatment. Following 16 weeks of treatment, significant improvementsin FMD were only observed in the vitamin D group(1.8 ± 1.3%), whereas the placebo group had no change (-1.3 ± 0.6%).Similarly, the vitamin D group exhibited anincrease in absolute change in diameter (0.005 ± 0.004 cm) and FMD/shear(0.08 ± 0.04 %/s(-1), area under the curve (AUC) × 10(3)) followingtreatment, whereas no change (-0.005 ± 0.002 cm and -0.02 ± 0.02 %/s(-1),AUC, respectively) was observed following placebo. | Harris, 2011 |
Gastricbypass | We evaluated three doses ofvitamin D3 (800, 2,000, and 5,000 IU/day) in a prospective, randomized pilottrial of 45 patients undergoing Roux-en-Y gastric bypass. | At 12 months, the 800-,2,000-, and 5,000-IU groups had a mean +/- SD increase in 25OHD of 27.5 +/-40.0, 60.2 +/- 37.4, and 66.1 +/- 42.2 nmol/L, respectively (p = 0.09) with amaximum increase in each group of 87.4, 114.8, and 129.8 nmol/L. Forty-fourpercent, 78%, and 70% achieved 25OHD levels >or=75 nmol/L (p = 0.38). | Goldner, 2009 |
Glucose(fasting plasma) (FPG) | A total of 314 Caucasian adults without diabetesreceived either 500 mg calcium citrate and 700 IU vitaminD(3) or placebos daily for 3 years in a double-blind, randomized,controlled trial designed for bone-related outcomes. | Among participants with IFG at baseline, those whotook combined calcium-vitamin D supplements hada lower rise in FPG at 3 years compared with those on placebo (0.02 mmol/l[0.4 mg/dl] vs. 0.34 mmol/l [6.1 mg/dl], respectively, P = 0.042) and a lowerincrease in HOMA-IR (0.05 vs. 0.91, P = 0.031). | Pitas, 2007 |
Haemodialysis | HD patients were included in this study if theirserum 25(OH)D level was <75 mmol/L. Oral 25(OH)D(3) was administered dailyat 10-30 microg/day based on the severity of the deficiency. | After 6 months of treatment [mean daily 25(OH)D(3):16 +/- 5 microg/day], the serum 25(OH)D level increased (30 +/- 19 to 126 +/-46 nmol/ L, P < 0.001), with 13% of patients in group 1, 57% in group 2and 30% in group 3. The serum intact parathyroid hormone (iPTH) leveldecreased (235 +/- 186 to 189 +/- 137 pg/mL, P = 0.05), except in group 1.Bone alkaline phosphatase (BALP) showed a tendency to normalize (23 +/- 16 to18.3 +/- 11 microg/L, P < 0.05), leading to a decrease in alfacalcidoladministration from 66% to 43% (P < 0.05), except in group 1. The KDOQItargets achieved increased significantly for serum calcium (76% to 85%) andphosphate levels (66% to 77%) in all patients. The serum albumin levelincreased in all groups (34.6 +/- 4 to 36.8 +/- 4 g/L, P < 0.05), withoutany significant improvement in normalized protein catabolic rate (nPCR) orC-reactive proteins (CRP). | Jean, 2008 |
Heartfailure, congestive | either 50 mug vitamin D(3)/dplus 500 mg Ca/d [D(+) group] or placebo plus 500 mg Ca/d [D(-) group] for 9mo | Comparedwith baseline, parathyroid hormone was significantly lower and theantiinflammatory cytokine interleukin 10 was significantly higher in the D(+)group after 9 mo. The proinflammatory cytokine tumor necrosis factor alphaincreased in the D(-) group but remained constant in the D(+) group. Thesurvival rate did not differ significantly between the study groups duringthe follow-up period. | Schleithoff, 2006 |
Infectiousdiseases | Yamshchikov, 2009 | ||
Infections,symptomatic upper respiratory tract | 50 microg vitamin D3 (2000 IU) daily or matchingplacebo for 12 weeks. | The mean 25-hydroxyvitamin D level at baseline wassimilar in both groups (64.3+/-25.4 nmol/l in the vitamin D group; 63.0+/-25.8nmol/l in the placebo group; n.s.). After 12 weeks, 25-hydroxyvitamin Dlevels increased significantly to 88.5+/-23.2 nmol/l in the vitamin D group,whereas there was no change in vitamin D levels in the placebo group. Therewas no benefit of vitamin D3 supplementation in decreasing the incidence orseverity of symptomatic URIs during winter. | Li-Ng, 2009 |
Inflammation | Vitamin Dstatus was the sole determinant of circulating MMP9 (inversely) and anindependent determinant of CRP (inversely). Determinants of TIMP-1 were MMP9,systolic blood-pressure (directly) and VDR genotype (TaqI). Significantreductions in MMP9 (-68%), TIMP-1 (-38%) and CRP (-23%) concentrationsfollowed vitamin-D supplementation. | Timms, 2002 | |
2000 IU/d vitamin D3 given to diabetics | VitaminD deficiency was common, affecting 36% of patients. There was no impact ofhypovitaminosis D on metabolic syndrome status, HbA1c or insulin use (p>or= 0.4 for all) and no association between 25OHVitD and ferritin orhsCRP (p >or= 0.3 for all). Neither BMI nor the metabolic syndromeaffected the incremental rise in 25OHVitD levels during supplementation. | Luo, 2009 | |
Influenza | 800 or 2000 IU/d | 40 or 90% reduction | Aloia & Li-Ng, 2007 |
Influenzatype A | 1100 IU/d, no other oral intake | RR: 0.36; 95% CI: 0.17, 0.79; P = 0.006 No effect for type B | Urashima, 2010 |
Insulinsensitivity | 120,000 IU/fortnight | Seventy-one of the recruited subjects completed thestudy (35 in supplemented group, 36 in control group). There was an increasein oral glucose insulin sensitivity (OGIS) with supplementation by perprotocol analysis (P = 0.038; intention-to-treat analysis P = 0.055). Theage- and baseline 25-hydroxyvitamin D level-adjusted difference in change inOGIS was highly significant (mean difference 41.1 +/- 15.5; P = 0.01). Nochanges in secondary outcome measures (insulin secretion, basal indices ofinsulin sensitivity, blood pressure or lipid profile) were found withsupplementation. | Nagpal, 2009 |
double-blind intervention administering 100 microg(4000 IU) vitamin D(3) (n 42) or placebo (n 39) daily for 6 months to SouthAsian women, aged 23-68 years, living in Auckland, New Zealand | Significant improvements were seen in insulinsensitivity and IR (P = 0.003 and 0.02, respectively), and fasting insulindecreased (P = 0.02) with supplementation compared with placebo. | Von hurst, 2010 | |
Onlysubjects in the intervention group received one intramuscular injection of300,000 IU of vitamin D3. HbA(1c), serum 25-hydroxyvitamin D3, fastinginsulin and blood glucose, C-peptide, homeostasis model assessment insulinresistance index (HOMA-IR), β-cell function, insulin sensitivity and theQuantitative Insulin Sensitivity Check Index (QUICKI) were measured atbaseline and after 3 months of intervention. | Approximately80% of the mothers had a degree of vitamin D deficiency. Post-intervention,this was found in 4.2 and 71.4% in the intervention and control groups,respectively. The medians of HOMA-IR indices before and after interventionwere 0.6 and 0.5 (P = 0.7), respectively, in subjects in the interventiongroup, and 0.5 and 0.9 (P = 0.01) in subjects in the control group. The meanof the QUICKI fell only in the control group (P = 0.008). In the controlgroup, β-cell function increased by ~8% (P = 0.01) and insulinsensitivity decreased after 3 months (P = 0.002). Post-intervention, themedian C-peptide decreased in the intervention group and increased in thecontrol group, but the change was significant only in the control group (P =0.03). | Mozaffari-Khosravi, 2012 | |
participants with low serum 25(OH)D levels werethereafter randomized to receive capsules of 20,000 IU vitaminD(3) or identical-looking placebo twice weekly for 6 months. | The 52 participants with high serum 25(OH)D levels(85.6 ± 13.5 nmol/L [mean ± SD]) had significantly higher insulin sensitivityindex (ISI) and lower HbA(1c) and triglycerides (TGs) than the 108participants with low serum 25(OH)D (40.3 ± 12.8 nmol/L), but the differencesin ISI and TGs were not significant after adjustments. After supplementation,serum 25(OH)D was 142.7 ± 25.7 and 42.9 ± 17.3 nmol/L in 49 of 51 completingparticipants randomized to vitamin D and 45 of53 randomized to placebo, respectively. At the end of the study, there wereno statistically significant differences in the outcome variables between thetwo groups. | Grimnes, 2011 | |
cholecalciferol (2000 IU once daily) or calciumcarbonate (400 mg twice daily) for 16 wk. | The disposition index increased in the vitamin D group and decreased in the no-vitamin D group (adjusted mean change ± SE: 300 ± 130compared with -126 ± 127, respectively; P = 0.011), which was explained by animprovement in insulin secretion (62 ± 39 compared with -36 ± 37 mU · L(-1) ·min, respectively; P = 0.046). Hb A(1c) increased less, but nonsignificantly,in the vitamin D group than in the no-vitamin D group (0.06 ± 0.03% compared with 0.14 ±0.03%, respectively; P = 0.081). | Mitri, 2011 | |
Musclestrength | 6-month supplementation(December to May) of daily calcium plus monthly placebo (calcium/placebogroup) or daily calcium plus oral cholecalciferol (150,000 IU once a monthduring the first 2 months, followed by 90,000 IU once a month for the last 4months; calcium/vitamin D group) | SHFwas increased in the calcium/vitamin D group by 16.4% (p = 0.0001) and SKE by24.6% (p = 0.0007). [strength of hip flexors(SHF) and knee extensors (SKE)] | Moreira-Pfrimer, 2009 |
800 or 1600 IU/d plus vibration | Same improvements with both doses | Verschueren, 2011 | |
Twenty-six (87%) patients completed 3 months oftherapy. The percent increase in serum 25OHD (compared to baseline) was 82.7%in 2,000-IU group and 219.5% in 5,000-IU group. All participants (100%)achieved a serum 25OHD concentration >50 nmol/L; only 5 subjects(45.4%) in 2,000-IU group compared to 14 subjects (93.3%) in 5,000-IU groupachieved final 25OHD concentration ≥75 nmol/L (p < 0.01). | In the regression analysis, the reflexion point atwhich the PTH level increased above the normal range was calculated to be63.8 nmol/L 25OHD. All parameters of muscle strength showed trends inimprovements following the administration of both the 2,000 and 5,000 IUdoses. No patient reported untoward side effects and no patient developed | Diamond, 2012 | |
Musculoskeletalparameters | One hundred seventy-nine girls, ages 10-17 yr, wererandomly assigned to receive weekly oral vitamin Ddoses of 1,400 IU (equivalent to 200 IU/d) or 14,000 IU (equivalent to 2,000IU/d) in a double-blind, placebo-controlled, 1-yr protocol. | In the overall group of girls, lean mass increasedsignificantly in both treatment groups (P < or = 0.05); bone area andtotal hip BMC increased in the high-dose group (P < 0.02). Inpremenarcheal girls, lean mass increased significantly in both treatmentgroups, and there were consistent trends for increments in BMD and/or BMC atseveral skeletal sites, reaching significance at lumbar spine BMD in thelow-dose group and at the trochanter BMC in both treatment groups. There wasno significant change in lean mass, BMD, or BMC in postmenarcheal girls. | El-Hajj, 2006 |
Multiplesclerosis | 6000 IU/d vitamin D2 vs. 1000IU/d vitamin D2 | There were 4 relapses with high-dose D2 vs none withlow-dose D2 (p = 0.04). | Stein, 2011 |
Neuromuscular | 8400 IU/week | significantly reduced sway compared with treatmentwith placebo (P = 0.047) in patients with elevated baseline sway but not inpatients with normal baseline sway. | Lips, 2010 |
Periodontaldisease | A cohort of 51 subjects receiving periodontal maintenance therapy was recruited from twodental clinics; 23 were taking vitamin D(>or=400 IU/day) and calcium (>or=1,000 mg/day) supplementation, and 28were not taking such supplementation. All subjects had at least twointerproximal sites with >or=3 mm clinical attachment loss. Daily calciumand vitamin D intake (from food and supplements)were estimated by nutritional analysis. | Compared to subjects who did not take vitamin D and calcium supplementation, supplementtakers had shallower probing depths, fewer bleeding sites, lower gingivalindex values, fewer furcation involvements, less attachment loss, and lessalveolar crest height loss. The repeated-measures analysis indicated thatcollectively these differences were borderline significant (P = 0.08). | Miley, 2009 |
Physicalperformance | gait speed was higher among subjects supplementedwith vitamin (whether trained or not) than in non-supplemented subjects(838+/-147 and 768+/-127 m/12 min, respectively, p=0.02). | Bunout, 2006 | |
Pneumonia | Children, 100,000 IU D3 once | Childrenin the vitamin D(3) group survived longerwithout experiencing a repeat episode (72 days vs. 59 days; HR 0.71; 95% CI0.53-0.95; P = 0.02). | Manaseki-Holland, 2010 |
Oral vitamin D (1000 IUfor <1 year and 2000 IU for >1 year) (n=100) or placebo (lactose)(n=100) once a day for 5 days, from enrolment. | Median duration (SE, 95% CI) of resolution of severepneumonia was similar in the two groups [vitamin D:72 (3.7, 64.7-79.3) hours; placebo: 64 (4.5, 55.2-72.8)hours]. Duration ofhospitalization and time to resolution of tachypnea, chest retractions, andinability to feed were also comparable between the two groups. | Choudhary & Gupta, 2011 | |
Pregnancy | 4000 IU/d | No adverse effects on serum or urine calcium | Hollis, 2011 |
Maternal 25(OH)D (n = 161) increased from 22.7 ng/mL(SD 9.7) at baseline to 36.2 ng/mL (SD 15) and 37.9 ng/mL (SD 13.5) in the2000 and 4000 IU groups, respectively. While maternal 25(OH)D change frombaseline did not differ between groups, 25(OH)D monthly increase differedbetween groups (P < .01). No supplementation-related adverse eventsoccurred. Mean cord blood 25(OH)D was 22.1 ± 10.3 ng/mL in 2000 IU and 27.0 ±13.3 ng/mL in 4000 IU groups (P = .024). | Aftercontrolling for race and study site, preterm birth and labor were inverselyassociated with predelivery and mean 25(OH)D, but not baseline 25(OH)D. | Wagner, 2012 | |
Respiratoryinfections | At baseline, the median serum 25(OH)D level was 7ng/mL (interquartile range: 5-10 ng/mL). At the end of the trial, follow-upwas 99% (n = 244), and the median 25(OH)D levels of children in the controlversus vitamin D groups was significantlydifferent (7 vs 19 ng/mL; P < .001). | Comparedwith controls, children receiving vitamin Dreported significantly fewer ARIs during the study period (mean: 0.80 vs0.45; P = .047), with a rate ratio of 0.52 (95% confidence interval:0.31-0.89). Adjusting for age, gender, and history of wheezing, vitamin D continued to halve the risk of ARI (rateratio: 0.50 [95% confidence interval: 0.28-0.88]). Similar results were foundamong children either below or above the median 25(OH)D level at baseline(rate ratio: 0.41 vs 0.57; P(interaction) = .27). | Camargo, 2012 |
Stressfractures | Navy females, 800 IU/d, 2000 mg/d calcium | 21% lower incidence | Lappe, 2008 |
Testosterone | Participants received either 83 μg (3,332 IU)vitamin D daily for 1 year (n = 31) or placebo (n =2 3). | Compared to baselinevalues, a significant increase in total testosterone levels (from 10.7 ± 3.9nmol/l to 13.4 ± 4.7 nmol/l; p < 0.001), bioactive testosterone (from 5.21± 1.87 nmol/l to 6.25 ± 2.01 nmol/l; p = 0.001), and free testosterone levels(from 0.222 ± 0.080 nmol/l to 0.267 ± 0.087 nmol/l; p = 0.001) were observedin the vitamin D supplemented group. By contrast, there was no significantchange in any testosterone measure in the placebo group | Pilz, 2011 |
Toothloss | Elderly, taking supplements or not | During the randomized trial, 11 of the 82 subjects(13%) taking supplements and 17 of the 63 subjects (27%) taking placebo lostone or more teeth (OR = 0.4; 95% CI: 0.2 to 0.9). | Krall, 2001 |
Tuberculosis | The subjects were randomised to receive vitamin D(0.25 mg/day) or placebo in a double blind method, during the 6th initialweek of Tb treatment. | Onehundred percent of the vitamin D group and only 76.7% of the placebo grouphad sputum conversion. This difference is statistically significant(p=0.002). | Nursyam, 2006 |
The intervention was 100,000 IU of cholecalciferolor placebo at inclusion and again 5 and 8 months after the start oftreatment. | Overall mortality was 15% (54of 365) at 1 year of follow-up and similar in both arms (30 of 187 for vitamin D treated and 24 of 178 for placebo; relativerisk, 1.19 [0.58-1.95]). | Wejse, 2009 | |
A single oral dose of 2.5 mg (100,000 IU) vitamin D | significantly enhanced the ability of participants'whole blood to restrict BCG-lux luminescence in vitro without affectingantigen-stimulated IFN-gamma responses. | Martineau, 2011 | |
Atbaseline, the mean (±SD) 25(OH)D concentration was 7 ± 4 ng/mL, and allconcentrations were <20 ng/mL. Vitamin D supplementation increased serum25(OH)D by a mean of 12.7 ng/mL compared with placebo (P < 0.0001). Atbaseline, 16 children in the vitamin D group and 18 in the placebo group wereTST positive (P = 0.7). | Over6 mo, TSTs converted to positive in 5 (11%) children receiving vitamin Dcompared with 11 (27%) receiving placebo (RR: 0.41; 95% CI: 0.16, 1.09; P =0.06). Only one TST conversion occurred among those whose serum 25(OH)Dconcentration increased to >20 ng/mL, whereas 8 TST conversions occurred inthose whose final 25(OH)D concentration remained <10 ng/mL (P = 0.05). Themean increase in stature was 2.9 ± 1.6 cm in the vitamin D group and 2.0 ±1.7 cm in the placebo group (95% CI: 2.16, 2.81; P < 0.003). | Ganmaa, 2012 |
See also web
- WikiPedia on Clinical Trials nothing about vitamin D
See also Vitamin D Life
Over 1000 Clinical Trials with Vitamin D INTERVENTION- Aug 2013
101 vitamin D INVERVENTION trials added during first 7 months of 2012
Proof that Vitamin D Works 38 items as of Dec 2013
Search Vitamin D Life for "W * grant" OR "William grant" 433 items as of Jan 2014
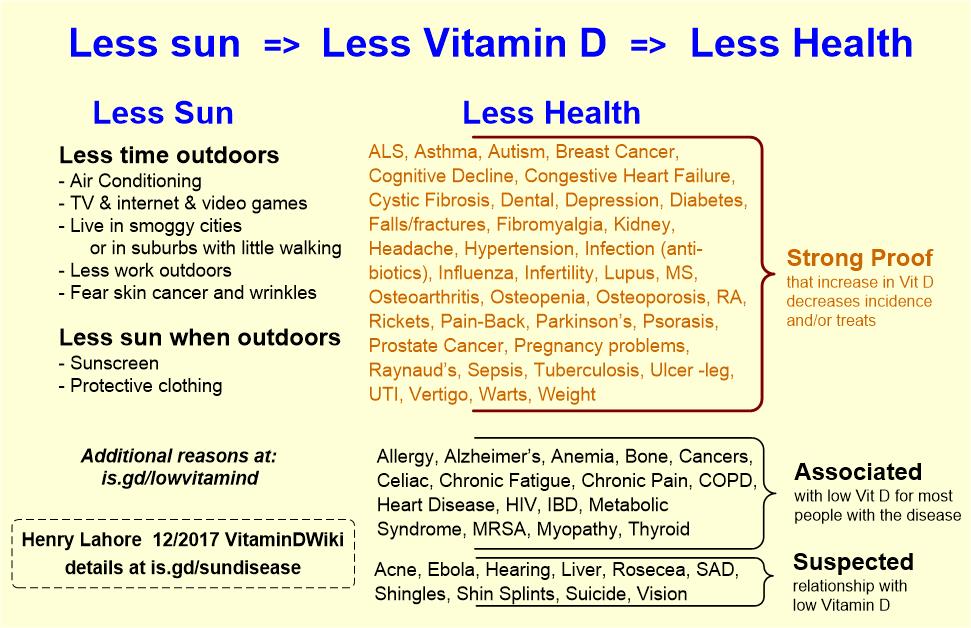
Hypothesis of cause and effect of vitamin D deficiency which has the following chart