Response to Vitamin D - Grassroots
The following charts are for people who are trying very hard to be healthy
They are taking far more measures than the average person to be healthy
Probably not much change due to type of tester -suspect that measurements are from mailed-in blood spot tests
No indication as to how many months of dosing before the blood test - but I suspect > 3 months
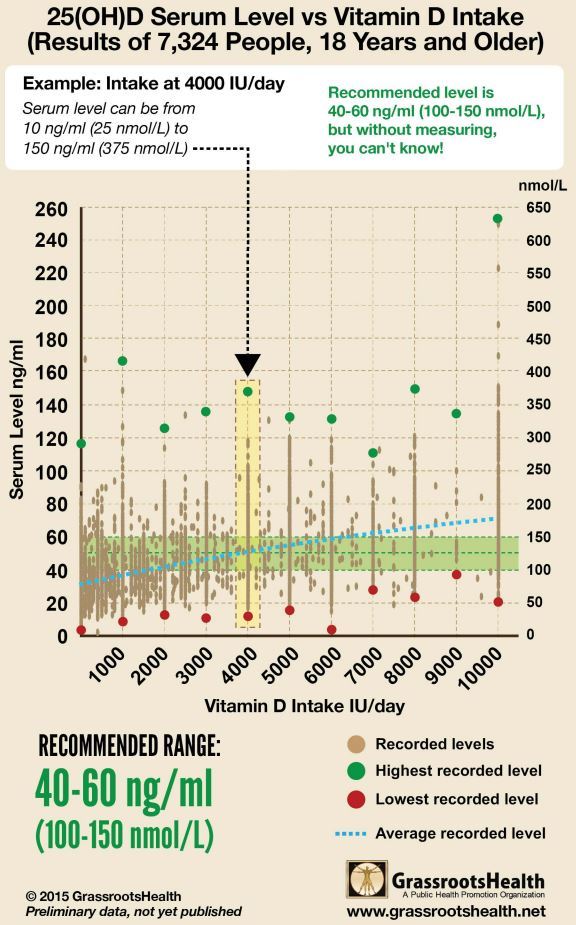
Huge range in response to the same dose of vitamin D
Example: response to 4,000 IU dose ranged from 10 ng to 150 ng (15 times!)
A few of the major reasons for this huge variability in response:
Obesity - obese need 2.5 times as much for the same response
Weight - participants might range in weight from 70 lbs to 500 lbs
Health problem which consumes vitamin D - such as: anemia, poor liver, poor gut, multiple sclerosis, diabetes,
Age - seniors have much less response to oral supplmentation - due to many of the above
Gallbladder had been removed ~600,000 annually in the US
Differences in (amount of skin) X (hours of noon-day sun) obtained in addition to oral supplementation
- Might range from 1 to 100 of square feet of skin-hours per week in the sun
- e.g. 1 square feet of skin exposed to 1 noon-day hour of sun per week
- to 10 square feet of skin for 10 hours of noon-day sun per week
see Reasons for low response to vitamin D for details
2015 chart
2013 chart (half as many people as 2015 chart)

See also Vitamin D Life
Overview Vitamin D Dose-Response has many graphs
Reasons for low response to vitamin D
- has the following chart, and a long table