Graphs of diseases vs vitamin D levels - and D3 vs D2
Graphs from a presentation by Dr. Grimes in London
PDF of the presentation is attached at the bottom of this page
CLICK HERE for audio and video versions on the web (Clinical Experiences)
Can see that the patients with East Asian Names have significantly lower vitamin D levels than those with British Names
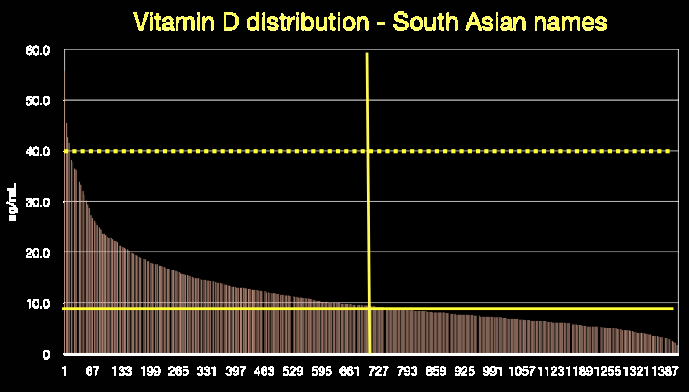
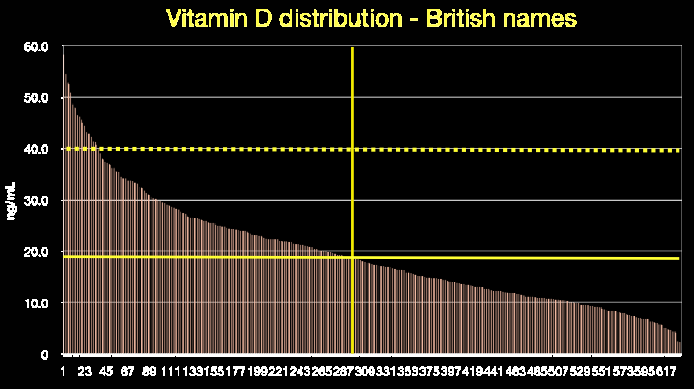
Median East Asian = 9 ng Median British = 19 ng
Note:patients with the lowest level of vitamin D in their blood are on the right
Graphs showing the vitamin D levels for each disease.
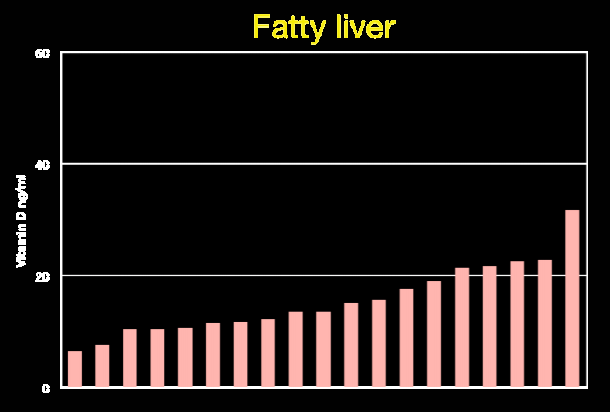
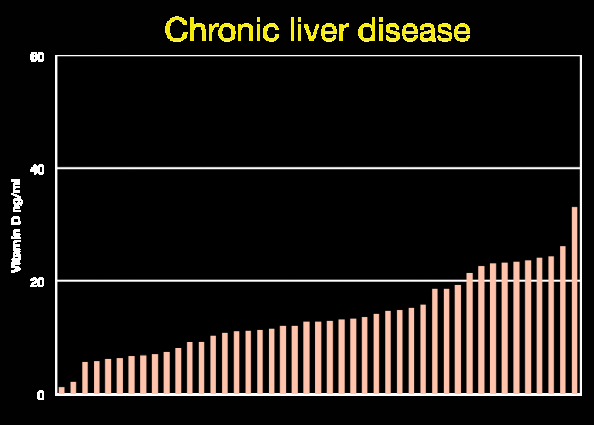
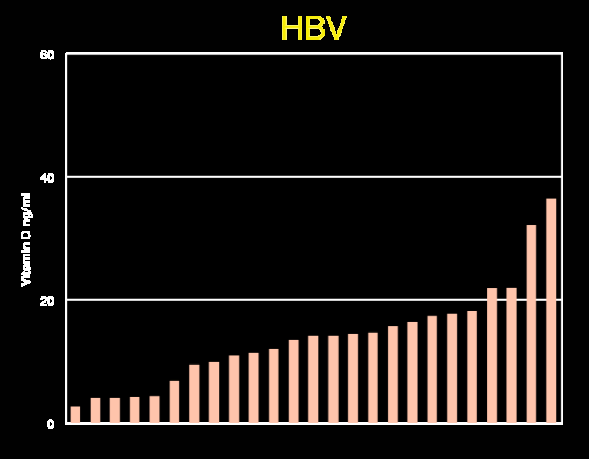
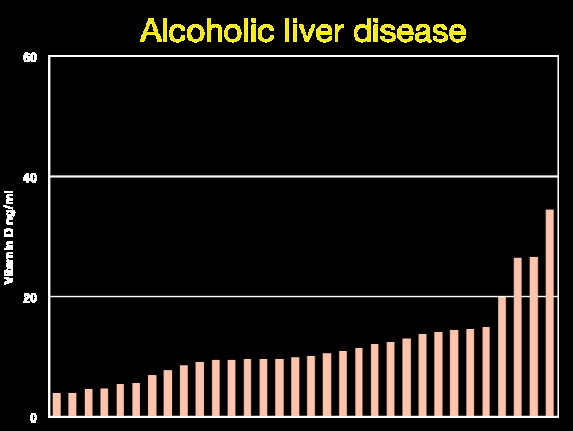
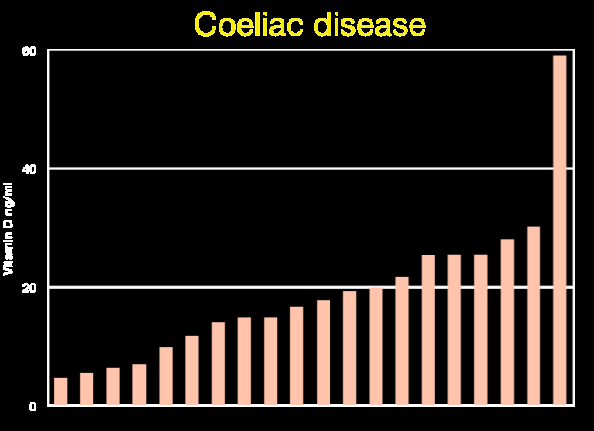
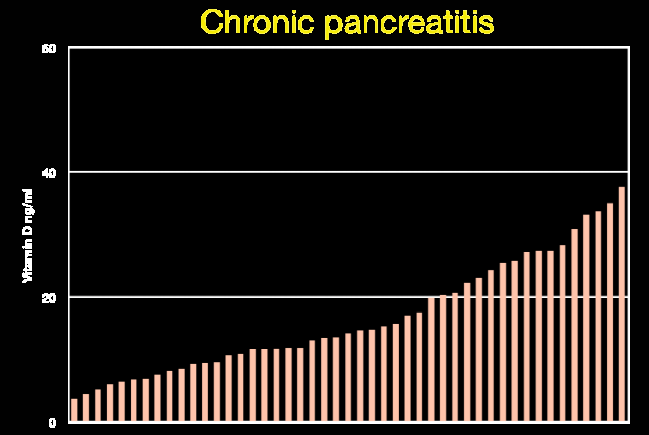
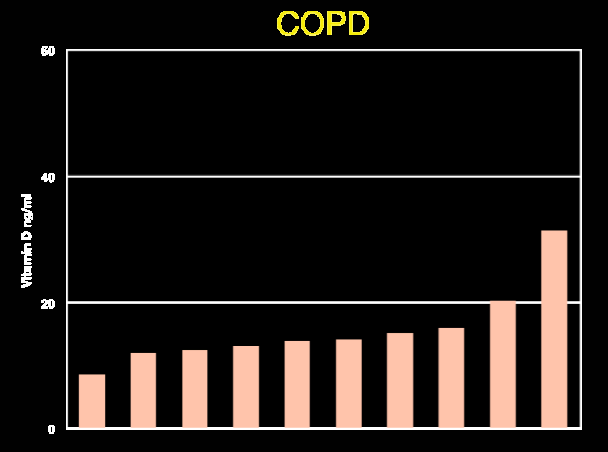
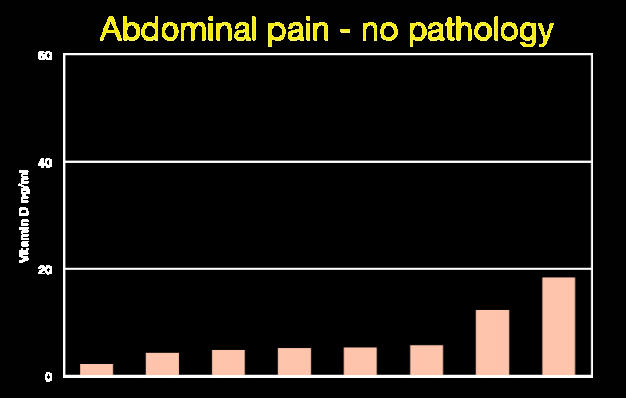
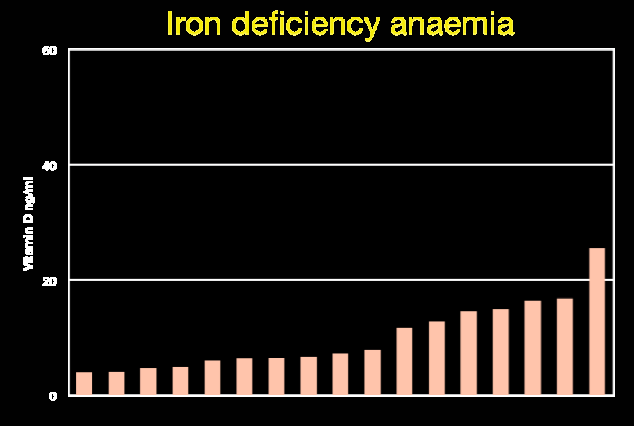
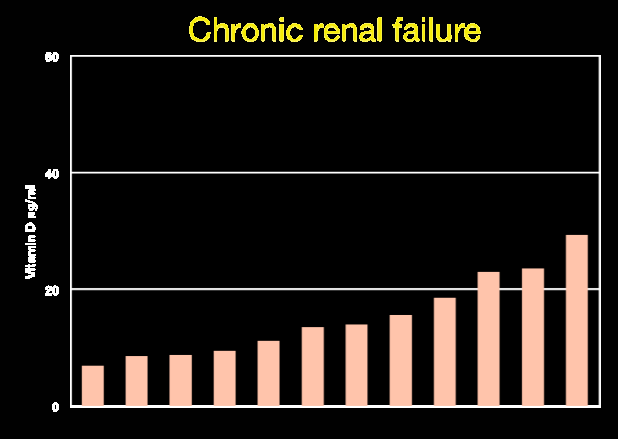
Note: most patients have <20 ng/ml and very rarely > 40 ng
!!!Note: the Horizontal axis is reversed from previous graphs
thus the patients with the highest level of vitamin D are on the right
Note: HBV = hepatitis B virus
{SPLIT(colsize=550|500)}
Far better response to D3 than D2
Response to 20,000 IU vitamin D3 extra per week

Most > 20ng and some > 40ng
Response to 20,000 IU of vitamin D2 per week (im = inter-muscular injection)
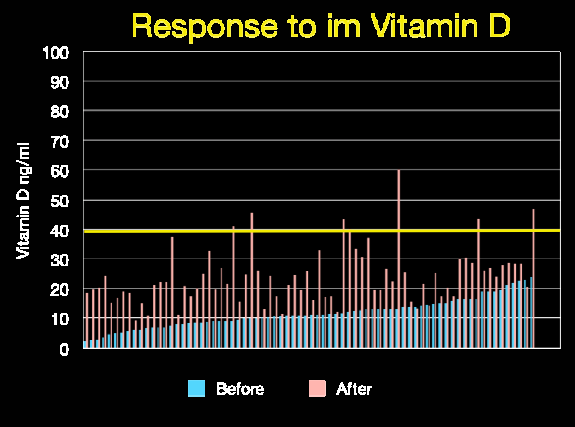
Very few got to 40ng
{SPLIT}
By Grimes on Vitamin D Life
Google Search of Vitamin D Life for Grimes about 57 items Oct 2013
Low vitamin D associated with low socio-economics in UK – Aug 2011
See also Vitamin D Life
Vitamin D2 loading dose actually decreased D3 after hip fracture – June 2011
Vitamin D insufficiency in UK youths – 37X more likely if dark skin – July 2011
- Dark Skin in a BIG PROBLEM = 37X more likely to be vitamin D insufficient in the UK
Many reasons why vitamin D deficiency has become epidemic in past 30-40 years