10 reasons for poor response to Vitamin D (race, binding protein, etc.)
Predictors of 25-Hydroxyvitamin D Concentration Measured at Multiple Time Points in a Multiethnic Population.
Am J Epidemiol. 2017 Nov 15;186(10):1180-1193. doi: 10.1093/aje/kwx180.
Knight JA, Wong J, Cole DEC, Lee TK, Parra EJ.
Vit D change over a year: due to supplementation, sunny vacation, etc. They include waist size, supplements, sunny vacation, time outdoors 10-2, race, binding gene, ageThey ignore genes which restrict vitamin D getting to cells (VDR, etc)They do not mention: smoking, poor gut, no gall-bladder, - which do not change over the space of a yearThey do not mention: decreased health/surgery, increased drugs, which decreases vitamin D
📄 Download the PDF from Researchgate via Vitamin D Life
The evidence for a relationship between serum vitamin D levels and nonskeletal health outcomes is inconsistent. The validity of single or predicted measurements of 25-hydroxyvitamin D (25(OH)D) concentration is unknown, as levels of this biomarker are highly seasonally variable. We compared models of 25(OH)D measured at baseline, at multiple time points throughout the year, and averaged over the year among 309 persons in Toronto, Ontario, Canada (43°N latitude) during 2009-2013.
Information and blood samples were collected every 2 months.
Baseline and average 25(OH)D concentrations were correlated (r = 0.88).
Major factors associated with 25(OH)D level were similar across models and included
race/ethnicity (concentrations in non-European groups were lower than those in Europeans),
vitamin D supplement use of ≥1,000 IU/day (18.9 nmol/L (95% confidence interval (CI): 16.1, 21.8) vs. no supplement use in a full data set with all factors), and the presence of the group-specific component/vitamin D
binding protein gene (GC/DBP) rs4588 functional polymorphism (AA vs. CC: -16.7 nmol/L (95% CI: -26.2, -7.1); CA vs. CC: -10.7 nmol/L (95% CI: -14.9, -6.5)).
Most factors had similar associations in Europeans and non-Europeans. Genetic factors may play a greater role in average 25(OH)D concentrations. Prediction models for 25(OH)D are challenging and population-specific, but use of genetic factors along with a few common population-relevant, quantifiable nongenetic factors with strong associations may be the most feasible approach to vitamin D assessment over time.
Related in VitamiDWiki
- Vitamin D Nutrigenomics - High, Medium, and Low Responders - March 2019
- No response to Vitamin D was 11 X more likely to have if poor Binding gene – Sept 2022 = GC
- CYP24A1 in title (31 as of Sept 2022)
- Reasons for low response to vitamin D
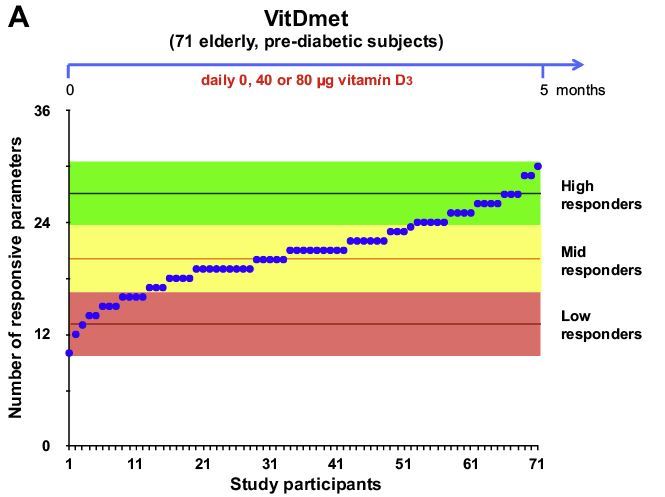
- Huge variation in response to vitamin D supplementation – personal vitamin D response index – Dec 2016 Carlberg
- Figure 2A daily dose of 3,200 IU
- items in Vitamin D Binding Protein category
- Obese need 2.5 IU of vitamin D per kg to increase 1 ng (about 3.4 X more) – RCT Sept 2013
- Predict Vitamin D category listing has items along with related searches** Items in both categories Genetics and Predict Vitamin D are listed here: {category}